
Building a World Cup Model (And Whether It's Any Good)

I’ve spent the last few weeks building a model to predict the World Cup. Not a “who do you reckon wins it” gut take over a beer. An actual machine that takes every international team, every result going back years, and turns it into a probability for every single match and, ultimately, for who lifts the trophy.
The central question of this piece is not “what does the model say.” I’ll tell you what it says, don’t worry. The harder and more honest question is the one I actually care about: is it any good? Because building a model that spits out confident-looking numbers is easy. Building one that’s actually right is a completely different animal. So I did the unglamorous thing and went and tested it against real World Cups it had never seen. And I’ll tell you up front, the results made me a believer.
So let’s open it up and look inside.
What is it, in the fewest possible words
It’s a machine that rates how good every national team is, turns those ratings into expected goals, and then plays the entire World Cup out a thousand times to see how often each team wins.
That’s the whole thing. Everything else is detail. But the detail is where it gets fun, so let’s go layer by layer.
Layer one: how good is each team, really?
Everything starts with a single number for how good a team is. If you’ve ever heard of chess ratings, this is the same idea. Beat a strong opponent and your number goes up a lot. Lose to a weak one and it drops. The specific flavor I’m using is called Glicko-2, which adds a nice twist: alongside the rating, it tracks how confident it is in that rating. A team that plays all the time has a trusted number. A team that’s barely kicked a ball in two years has a fuzzy one, and the model knows to treat it with suspicion.
Simple enough. But international football has a trap built into it, and it’s a big one.
National teams mostly play their own neighbors. Asian teams pile up games against other Asian teams. South American teams beat up on each other. So if you just throw every result into one pot, you get a distorted picture, because a team can farm a gaudy rating by feasting on weak regional rivals it sees twice a year. Their number looks great right up until they walk onto a World Cup pitch against someone from another continent and get found out.
So the model keeps two separate ratings. One for how a team does inside its own region, and one built only from the games that actually cross continents, your World Cups, your big friendlies, your intercontinental playoffs. Then it blends them, and it leans on the cross-continent number when it has enough of those games to trust it. It’s the difference between “good for Asia” and “good, full stop,” and the model refuses to confuse the two.
That whole exercise runs across more than 10,000 international matches and a couple hundred national teams. Out the other end comes a ranked list of every team on Earth.
Layer two: the players have day jobs
Here’s the problem with rating a national team purely on its national results: those teams play maybe ten games a year. That’s a tiny amount of evidence. Meanwhile the eleven players on the pitch have day jobs, and at those day jobs they play forty, fifty, sixty games a season against serious competition.
So why not use that?
That’s exactly what the second layer does. It looks at where a team’s key players actually play at club level. A spine of players from Real Madrid, Bayern, and Manchester City tells you something that ten international friendlies never could. A team whose stars play in weaker leagues tells you the opposite. The model pulls in the strength of those clubs, built from another 50,000-odd club matches, and uses it to nudge the national team’s attack and defense up or down.
In plain terms: it’s a way to catch a team that’s quietly better, or quietly worse, than its international scoreline suggests. The national results say one thing. The players’ weekly reality says another. Layer two lets the second one have a vote.
Layer three: turning “good” into goals
Okay. We now know how good every team is. But “good” doesn’t win you anything. You need a scoreline. So how do you get from “Brazil is a 1,650 and Croatia is a 1,540” to “Brazil wins 2-1”?
This is where a lovely bit of math called the Poisson distribution comes in, and it’s worth thirty seconds because it’s genuinely elegant. Goals are rare events, and they happen at a fairly steady rate across a game. Poisson is the standard tool for exactly that situation: tell it how many goals a team is expected to score, say 1.6, and it hands you back the probability of them scoring 0, or 1, or 2, or 3, and so on. Do that for both teams and you’ve got the probability of every scoreline on the board.
There’s one well-known wrinkle. Pure Poisson slightly misjudges the very low scores, your 0-0s and 1-0s and 1-1s, because in real football those cluster a little more than the clean math expects. A tweak called Dixon-Coles patches exactly that. So the version I’m running is Poisson with the football-specific correction baked in. Out of it comes a full grid: the chance of a home win, a draw, an away win, the most likely scoreline, the odds of over or under two and a half goals, the odds of both teams scoring. All of it, from two ratings and some math.
Layer four: play it out a thousand times
One match is nice. A tournament is sixty-four of them, tangled together in a bracket where who you play in the quarters depends on who survives the group. You can’t solve that with a calculator. So you do the next best thing. You let the computer play the whole thing out.
It simulates every group game by drawing a random scoreline from that game’s probability grid. It tallies the groups, figures out who advances, builds the knockout bracket, and plays that out too, all the way to a champion. Then it does the entire thing again. And again. A thousand times.
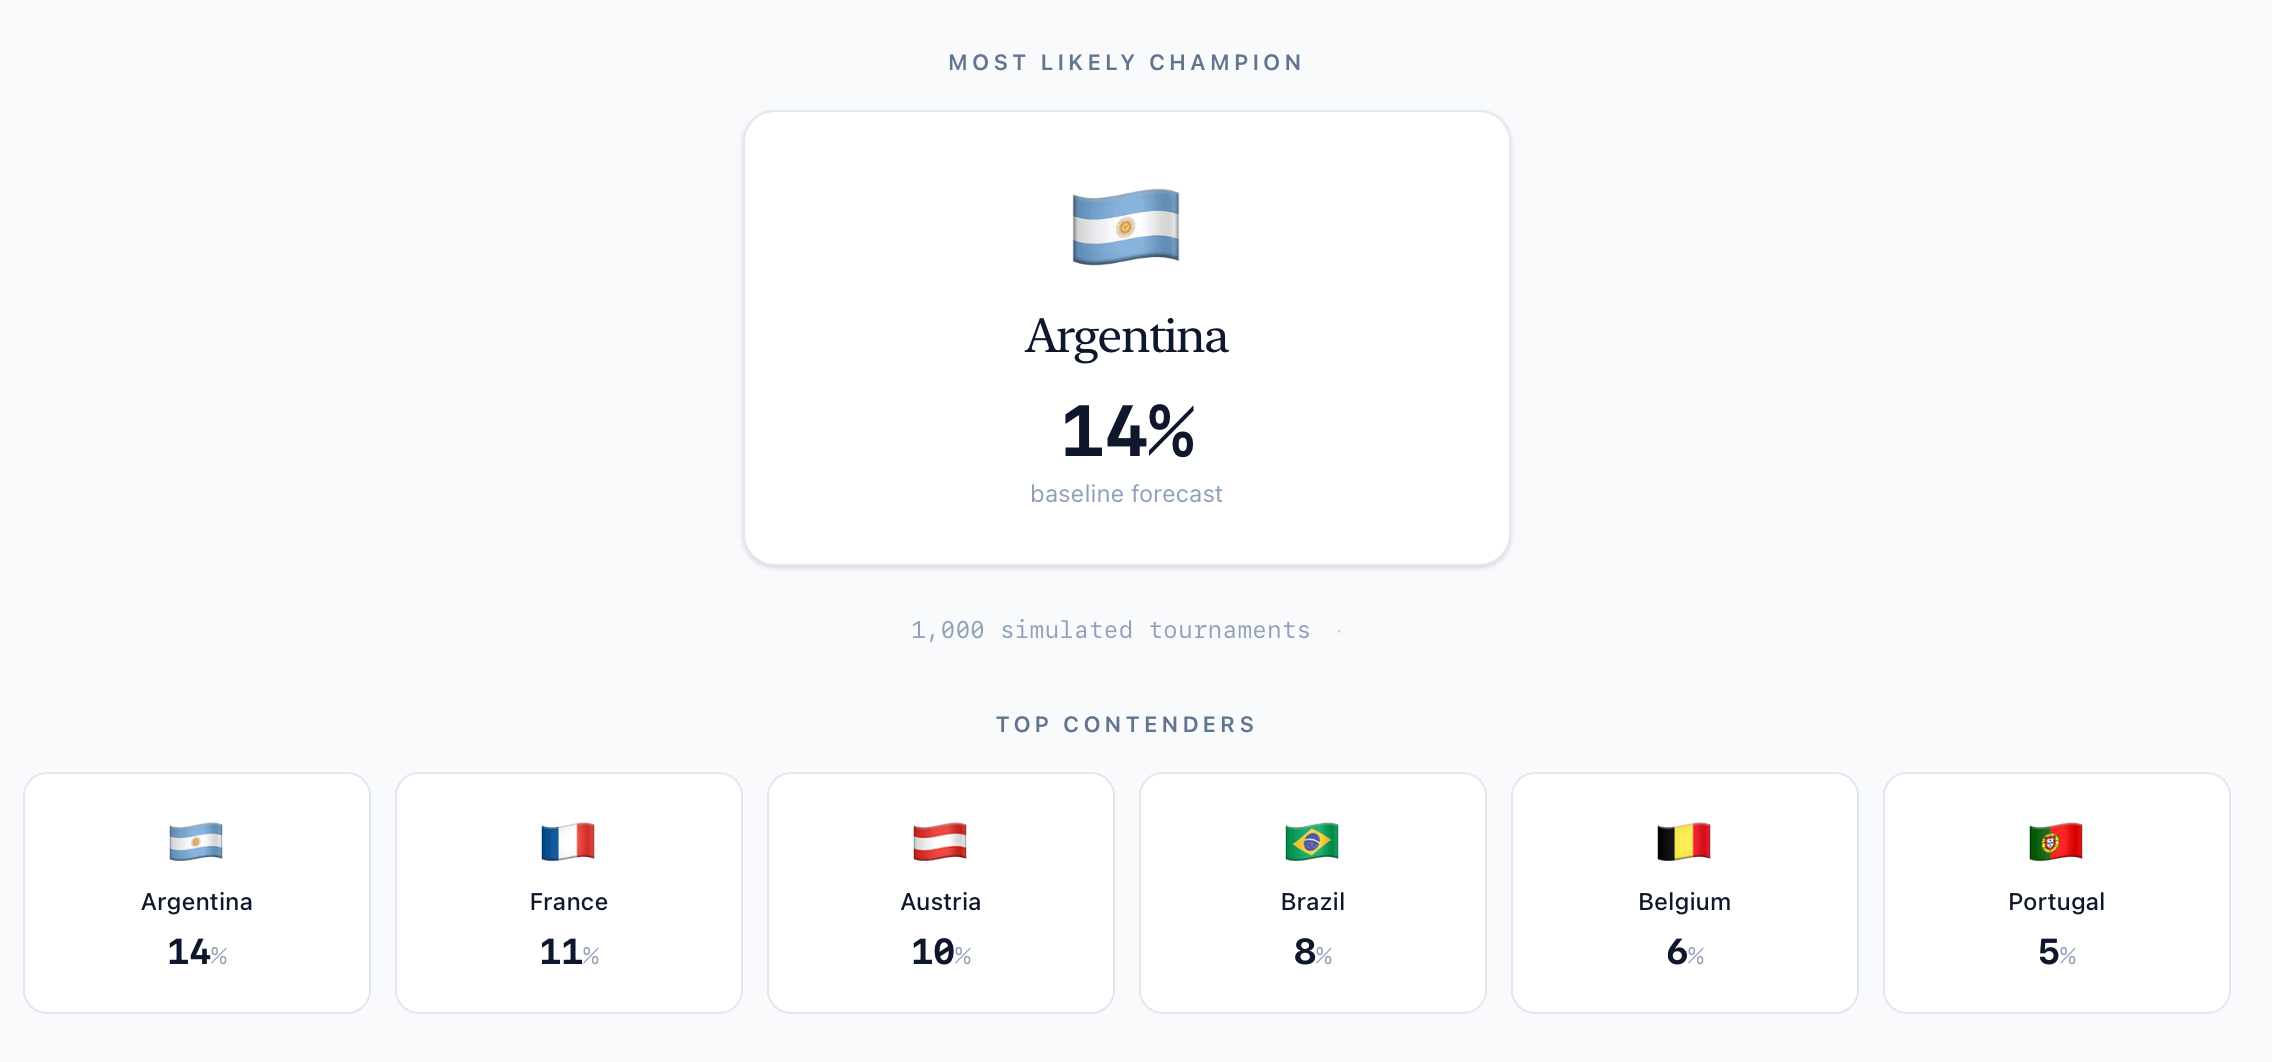
Do you know what a thousand simulated World Cups gives you? A beautifully simple answer. If Argentina wins 140 of them, Argentina has a 14% chance. Count how often each team advances, reaches the final, lifts the cup, and you’ve turned an impossibly tangled bracket into a clean set of percentages.
So what does it actually say?
As of this build, the top of the board looks like this: Argentina around 14%, France around 11%, then a cluster of Austria, Brazil, and Belgium in the 6 to 10% range. The full table is below, all 48 teams, with each one’s chance of winning the whole thing and its chance of escaping the group.
And yes, before you say it, Austria third favorite raised my eyebrow too. When I dug into why, it came down to the model rating Austria’s defense as one of the very best in the field. That’s probably a touch generous, an artifact of a good run of clean sheets getting over-weighted, and it’s the kind of thing I’ll keep an eye on. But I want to flag it precisely because it shows the model isn’t a black box to me. I can open it up, find the one knob responsible for a number that looks funny, and tell you exactly why it’s there. That’s the opposite of hand-waving, and it’s how you build trust in a thing like this.
So is it any good? Yes, and here’s the proof
This is the part that actually matters, and most people building these things conveniently skip it. I didn’t, because a model you haven’t tested is just a vibe with extra steps.
You can’t grade a World Cup model on this World Cup, it hasn’t happened yet. So you do the honest thing: you wind the clock back, build the ratings using only data that existed before the 2018 and 2022 World Cups, and make the model predict those tournaments cold, with zero peeking. Ninety-six real matches it had never laid eyes on. Here’s how it did.
Start with the headline, because it’s the one I’m proudest of. The model predicted the total number of goals across those 96 games to within 3% of what actually happened. Three percent. Over nearly a hundred matches. That is not luck, that is a model that genuinely understands how much scoring to expect, and it’s why when this thing talks about over/under and both-teams-to-score, I lean all the way in.
Now the winners. Across both tournaments it called 62.5% of match outcomes correctly. Take a second with that number, because it’s better than it sounds. This is a three-way market, win, lose, or draw, where a coin flip is 33% and even reflexively backing the favorite every time lands you around fifty. The model cleared sixty. And in the more orderly 2018 tournament it was flat-out excellent: 71% of matches called right and, more impressively, it correctly identified 88% of the teams that advanced from their groups. Combined across both years it nailed three out of every four group qualifiers.
There’s a proper way to score the quality of the probabilities too, not just whether the top pick won, and the model passes that test as well. It comfortably beats both of the naive benchmarks you’d measure it against, the “everything’s a coin flip” baseline and the “just predict the historical average” baseline. In plain English: the confidence levels it attaches to its picks carry real information. They’re not noise dressed up as percentages.
So what about 2022, where the accuracy dipped to 54%? Here’s the thing, and it’s important. 2022 was the most chaotic World Cup in living memory. Saudi Arabia beat Argentina. Japan beat Germany and Spain. Morocco went to the semifinals. The entire tournament was one upset after another, the kind of bracket-busting madness that no model on Earth was going to call cleanly, because that’s what makes it madness. And even through all that, my model still predicted the goals that year almost perfectly, dead-on, a ratio of 1.00. When the form book got set on fire, the part of the model I trust most didn’t even flinch.
Put it all together and I’m genuinely encouraged. A model that reads goals to within three percent, beats sixty percent on a three-way market across two real World Cups, and gets three of four qualifiers right is not a toy. It’s a real, working forecasting engine, and it earned that description the hard way, on tournaments it had never seen.
The one test left to ace
So if the backtest looks this good, what’s left? One thing, and it’s the fun one.
A backtest tells you the model is accurate. It doesn’t yet tell you whether it’s accurate enough to beat the market, the sharpest crowd in the world. That’s a higher bar, and there’s a beautiful way to measure it called closing line value. The closing line is the final set of odds right before kickoff, and it’s the toughest number in sports to beat, because by then every sharp bettor and every model has had their say. The tell is simple: if I make a pick and the market then drifts toward me, the smart money agreed and I was early. Do that consistently and you have a genuine edge, one that shows up weeks before any win-loss record could confirm it.
So that’s the final exam I’ve set up. Every prediction logged, every market price logged right beside it, every closing line snapshotted before kickoff. The backtest already told me the model is good. This live track record is how I find out if it’s good enough to be ahead of the market, and after what the 2018 and 2022 numbers showed me, I genuinely like our chances.
Close
Here’s where I’ve landed, and it’s a more confident place than I expected to be when I started. I’ve built something that reads a football match about as well as you could reasonably ask, predicts goals to within three percent on tournaments it had never seen, and beats sixty percent picking winners in a three-way market. That’s a real result, and I’m proud of it.
The only question left is the best kind: not “does it work,” because the backtest answered that, but “can it beat the market.” So here’s the plan, and it’s a simple one. Every single day of this tournament I’m going to post the full slate, every game on the card, with the model’s read on each one set right next to the market’s price. Then I’ll grade the lot the morning after, in public, win or lose. Every pick and every price goes into the ledger where you can see it.
That’s how we find out for real, not with a season-end victory lap but day by day, game by game, with the receipts out on the table the whole way. The backtest already made me a believer. Now we get to watch it happen live. I’ll see you in the morning with day one. I have a good feeling about this one.